Part I - Validation
CFD calculation vs. Experimental data
Comparison with experimental data
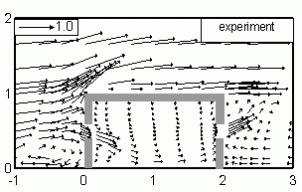
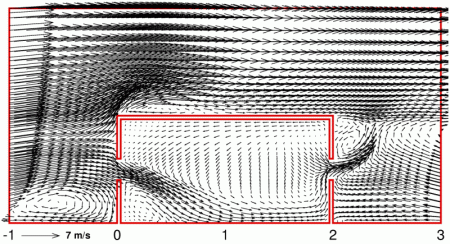
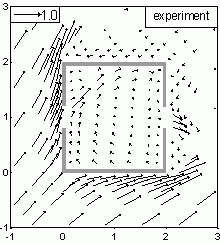
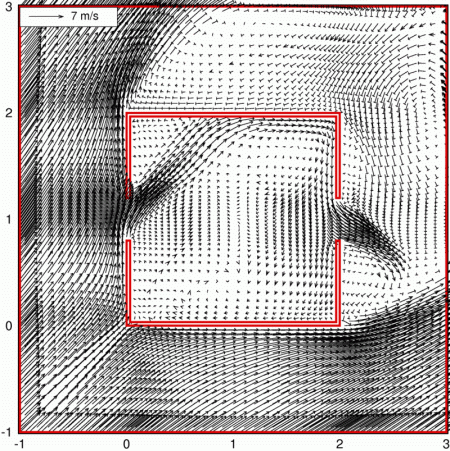
The mean velocity vectors have been measured in the wind tunnel test. Experimental data shows that the flow is separated at the leading edge of the roof and there is a standing vortex created in front of the windward side of the building. When the airflow is entering the building, the velocities are amplified and its direction is changed downwards immediately after passing through the opening. The internal air is circulated by the ventilating flow. At the exit, the velocities of the emitted air are accelerated and the mean flow changed its direction upwards immediately when leaving the building. The simulated flow field by CFD exhibits the same features in this comparison. The reference vector 1.0 indicates the reference velocity (7 m/s).
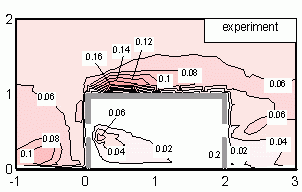
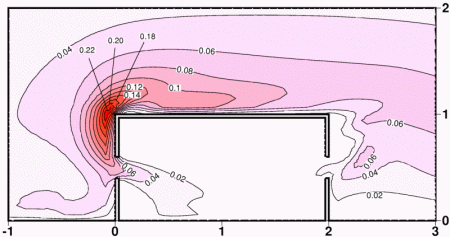
The distribution of the turbulent kinetic energy (k) has also been measured in the wind tunnel test. Maximum value of k is 0.16 in the experimental data, whereas the computation predicts a higher value (0.22) at the impinging area. Except this shortcoming, the general trend of the k distribution is depicted satisfactorily by CFD.
Additional comparison for oblique wind direction
It is interesting to observe the variation of the velocity vectors due to the change of wind direction. The data has been collected when the wind angle is 45o oblique to the centerline of the building. At the height (center) of the opening, the air flows into the building with an angle more than 45o and the internal air is circulated like eddies within the building. Flow separations are obvious at the windward corners and the flow separations also create two large vortices attached to the leeward sides of the building. Both of the experimental data and the CFD computation present the same flow pattern under this wind condition.
Flow rate calculation
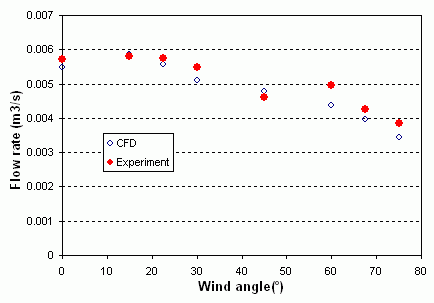
The flow rate calculated by CFD has also been compared. The comparison has shown that the flow rates calculated by CFD are in good agreement with experimental data for various wind directions.
